
Get started
Dashboard tour
Six pages per project, each answering one question. The overview decides what to do; the rest exist so you can check the decision.
Overview — what deserves this morning
The landing page of a project, in three layers: Today is the decision, Live Pulse and the dimension panel beside it are the diagnosis, and key metrics are the evidence. Every Today item links to the page that proves or disproves it.
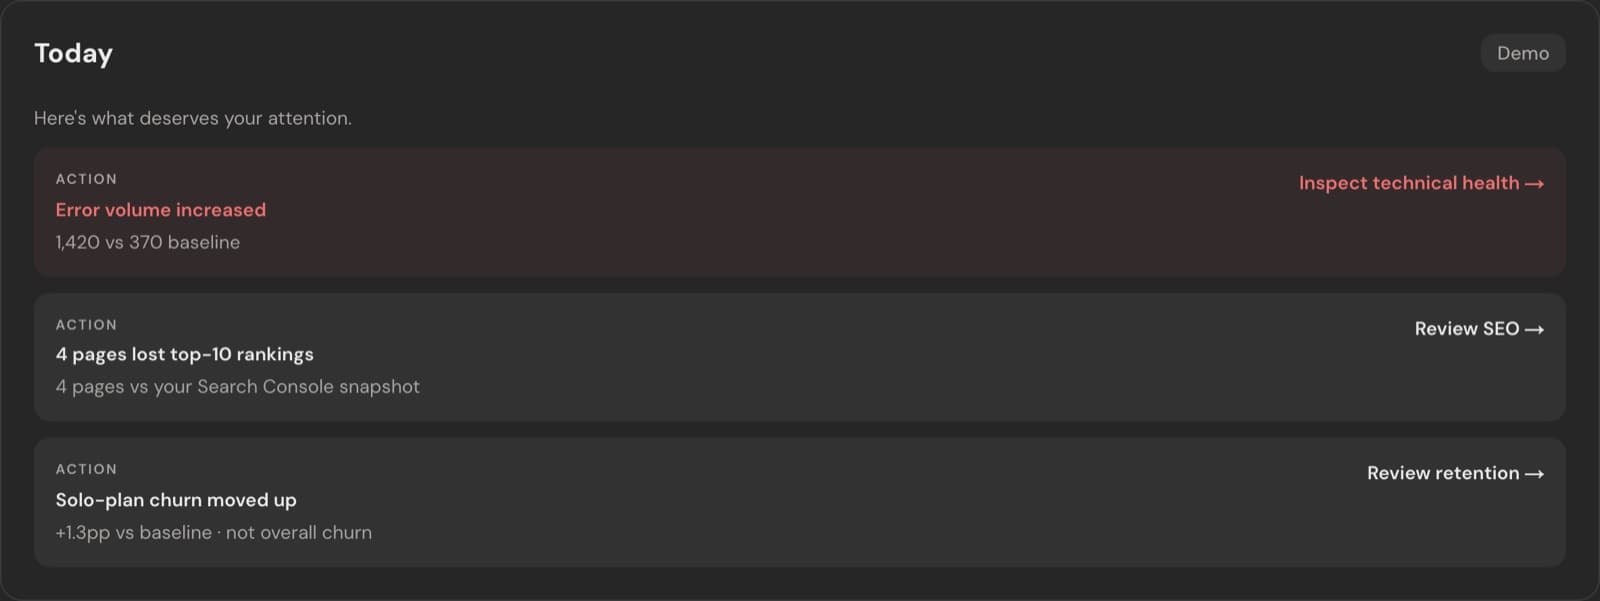
- Today is a selection, not a feed. When nothing is urgent it says so and moves recent changes into "worth knowing".
- Live Pulse carries the composite score, the 7-day trend, confidence, and how many dimensions are actually monitored.
- Key metrics — MRR, churn, visitors, organic, errors — each with its window and its delta against the baseline.
Analytics — where traffic comes from
First-party traffic for the selected period, from the Seiton snippet (or GA4 when the snippet is not installed). Sessions, bounce rate and session time are derived at read time from raw events, so definitions can change without rewriting history.
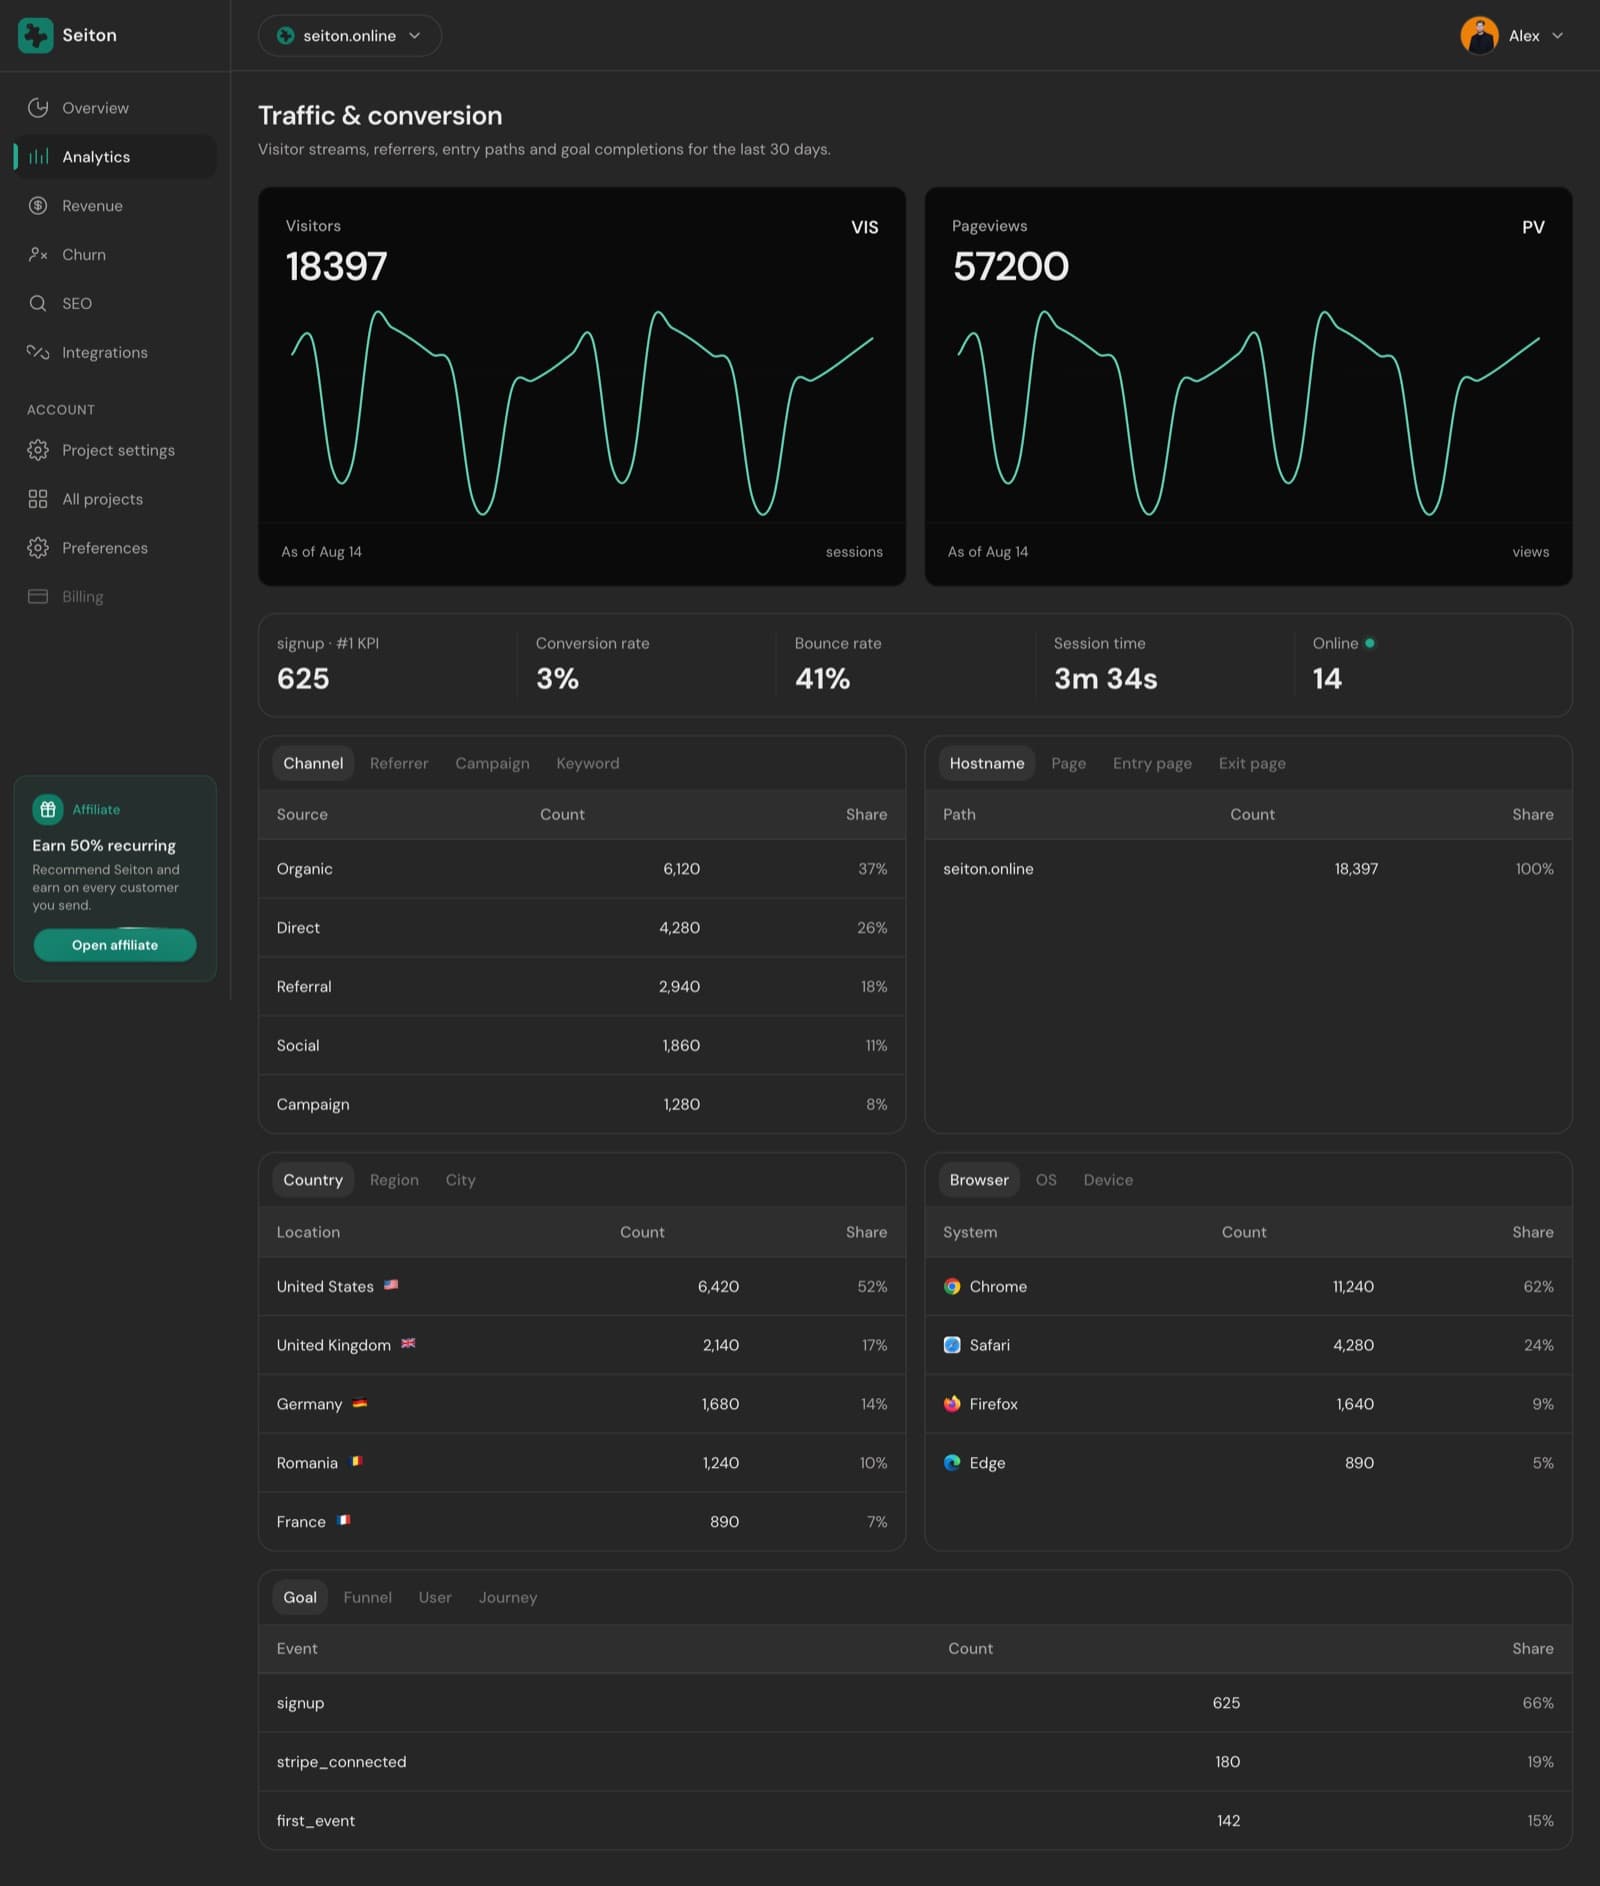
- Channel is classified from UTM values first, then the referrer host — Direct, Organic, Paid, Social, AI assistant, Email, Affiliate, Referral.
- Sessions split a visitor's events wherever they went quiet for 30 minutes. Bounce rate is single-pageview sessions over sessions.
- Funnels, journeys and crawler traffic are shown as unavailable rather than filled with estimates — a browser tracker never runs for a bot.
Revenue — MRR, attribution and margin
Everything the billing source reports, plus what it took to earn it. Attribution joins paid customers back to the channel and landing page that brought them, using the visitor id you attach at checkout.
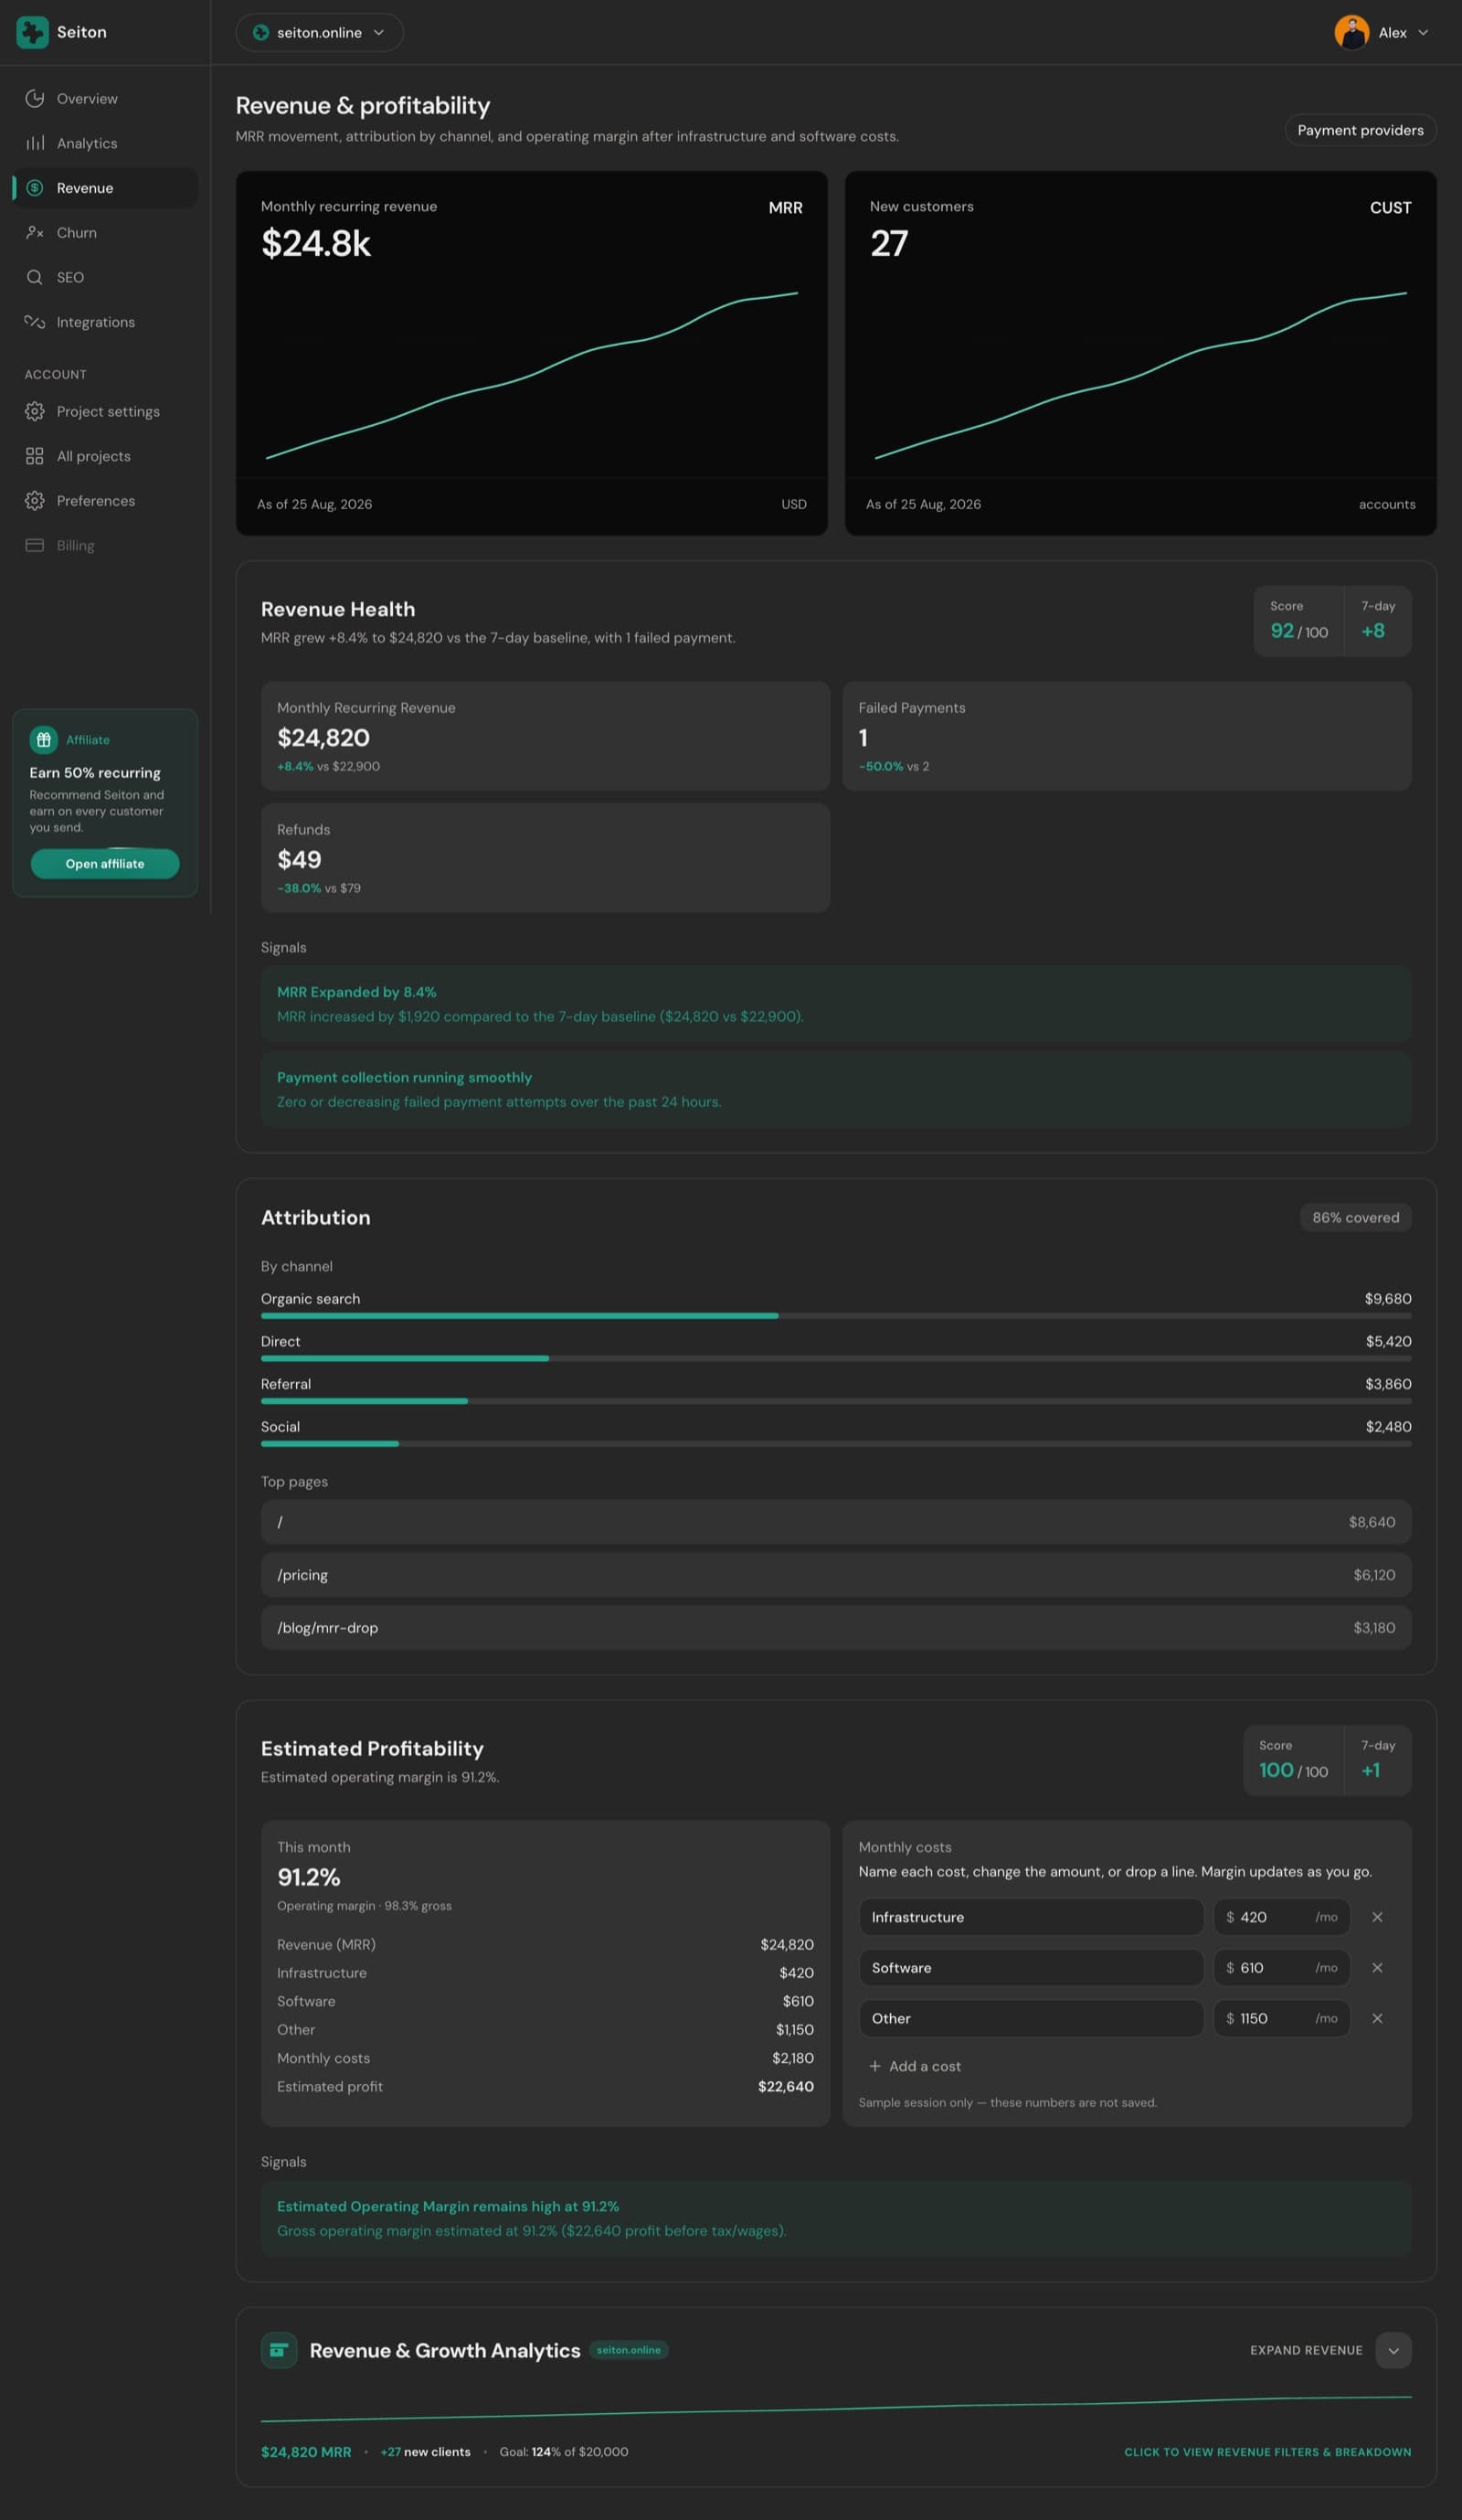
Estimated profitability needs your costs
MRR comes from billing. Infrastructure and software costs do not — add them in the Monthly costs panel (or through the API) and the operating-margin dimension starts scoring.
Churn — who is leaving, and who is about to
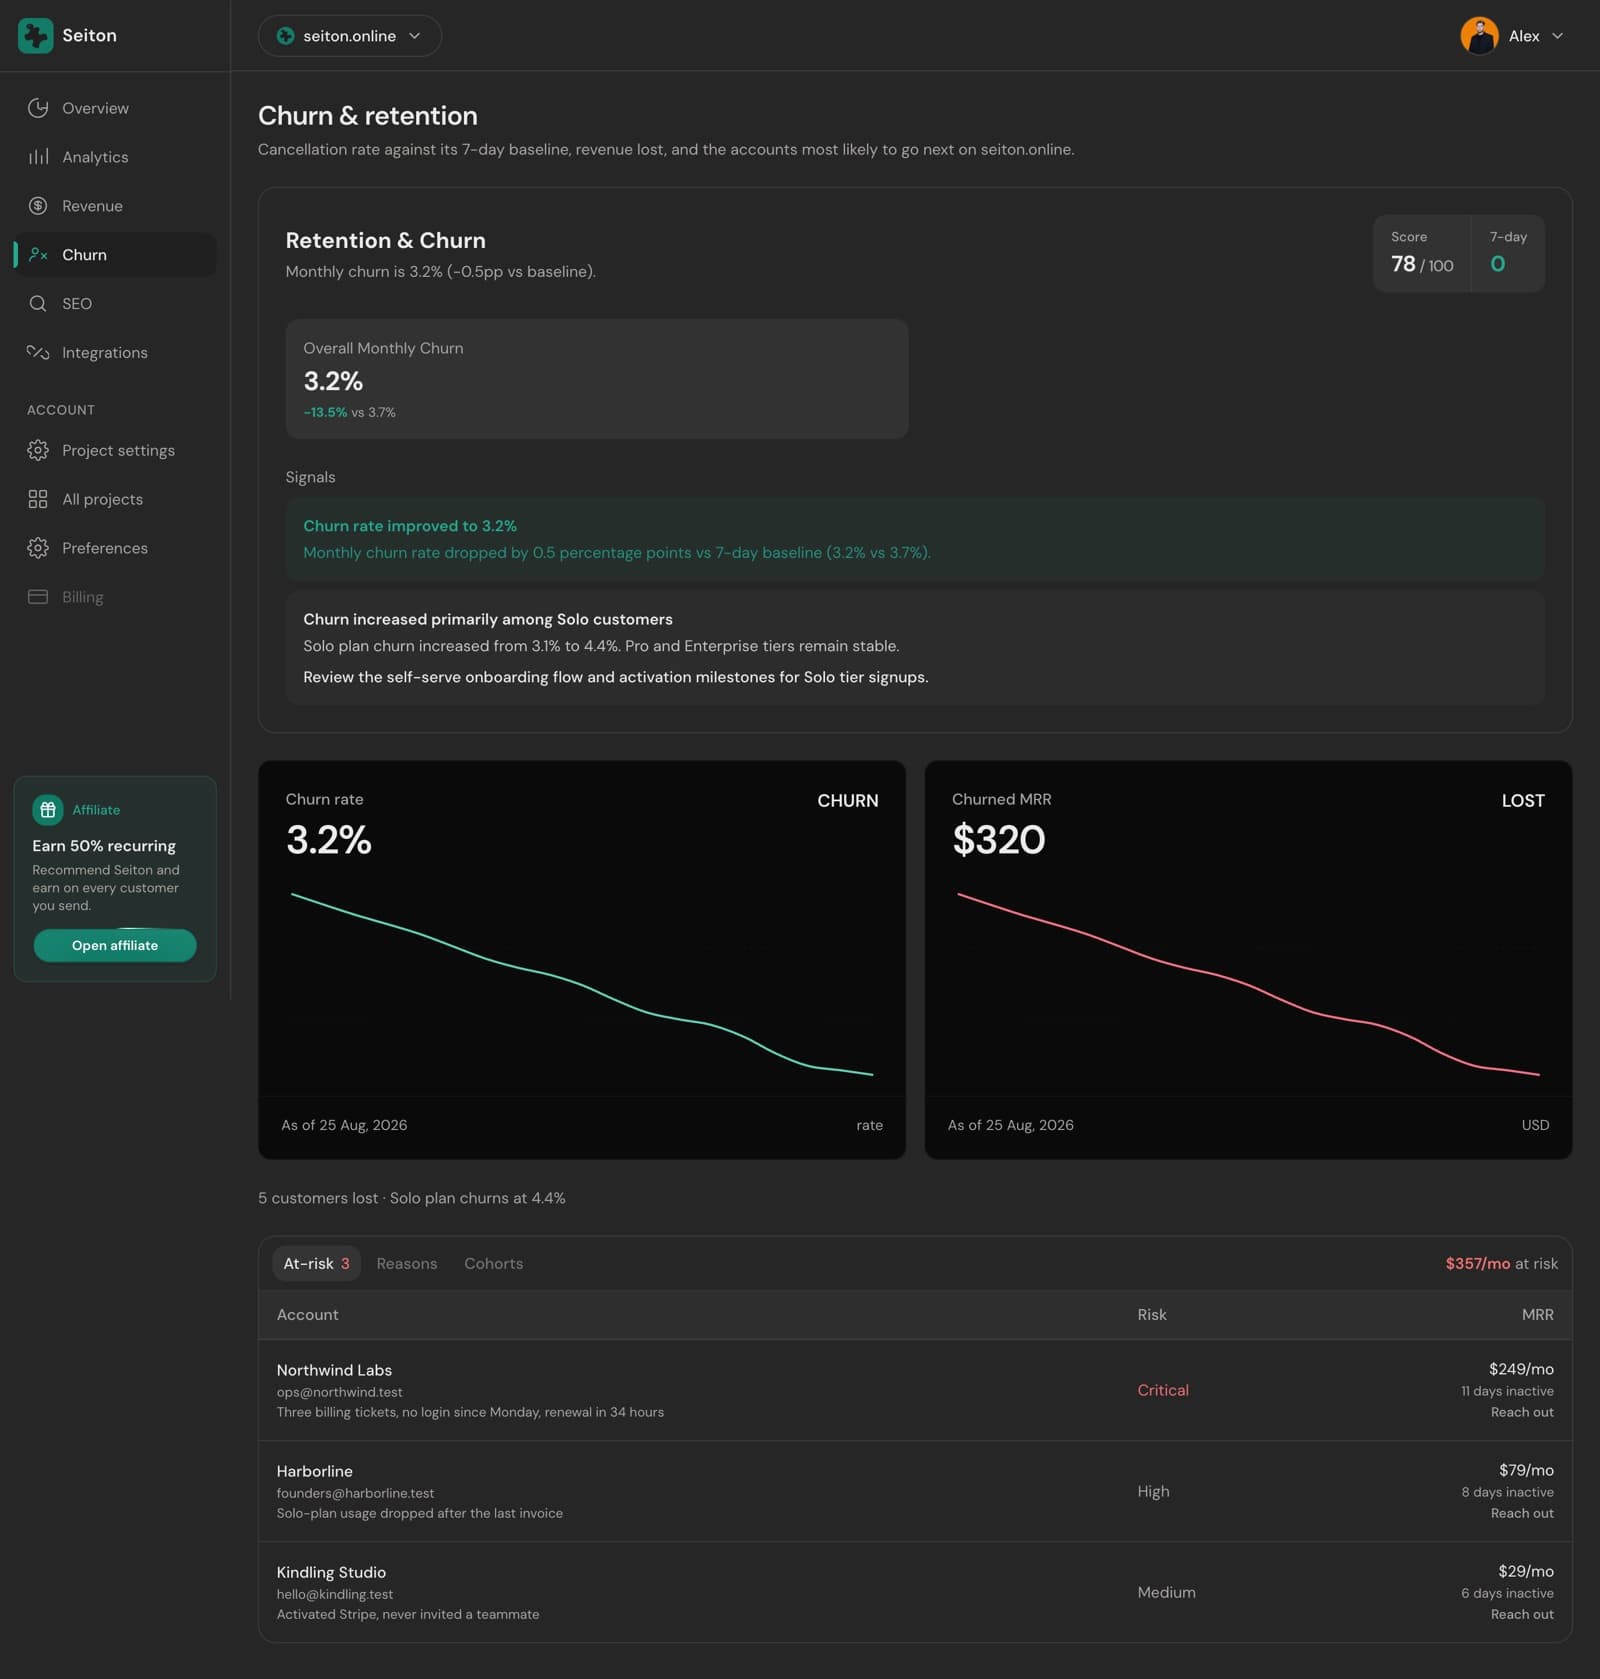
Cancellation rate against its baseline, the revenue that left with it, and the accounts most likely to go next — with the reason each one is flagged.
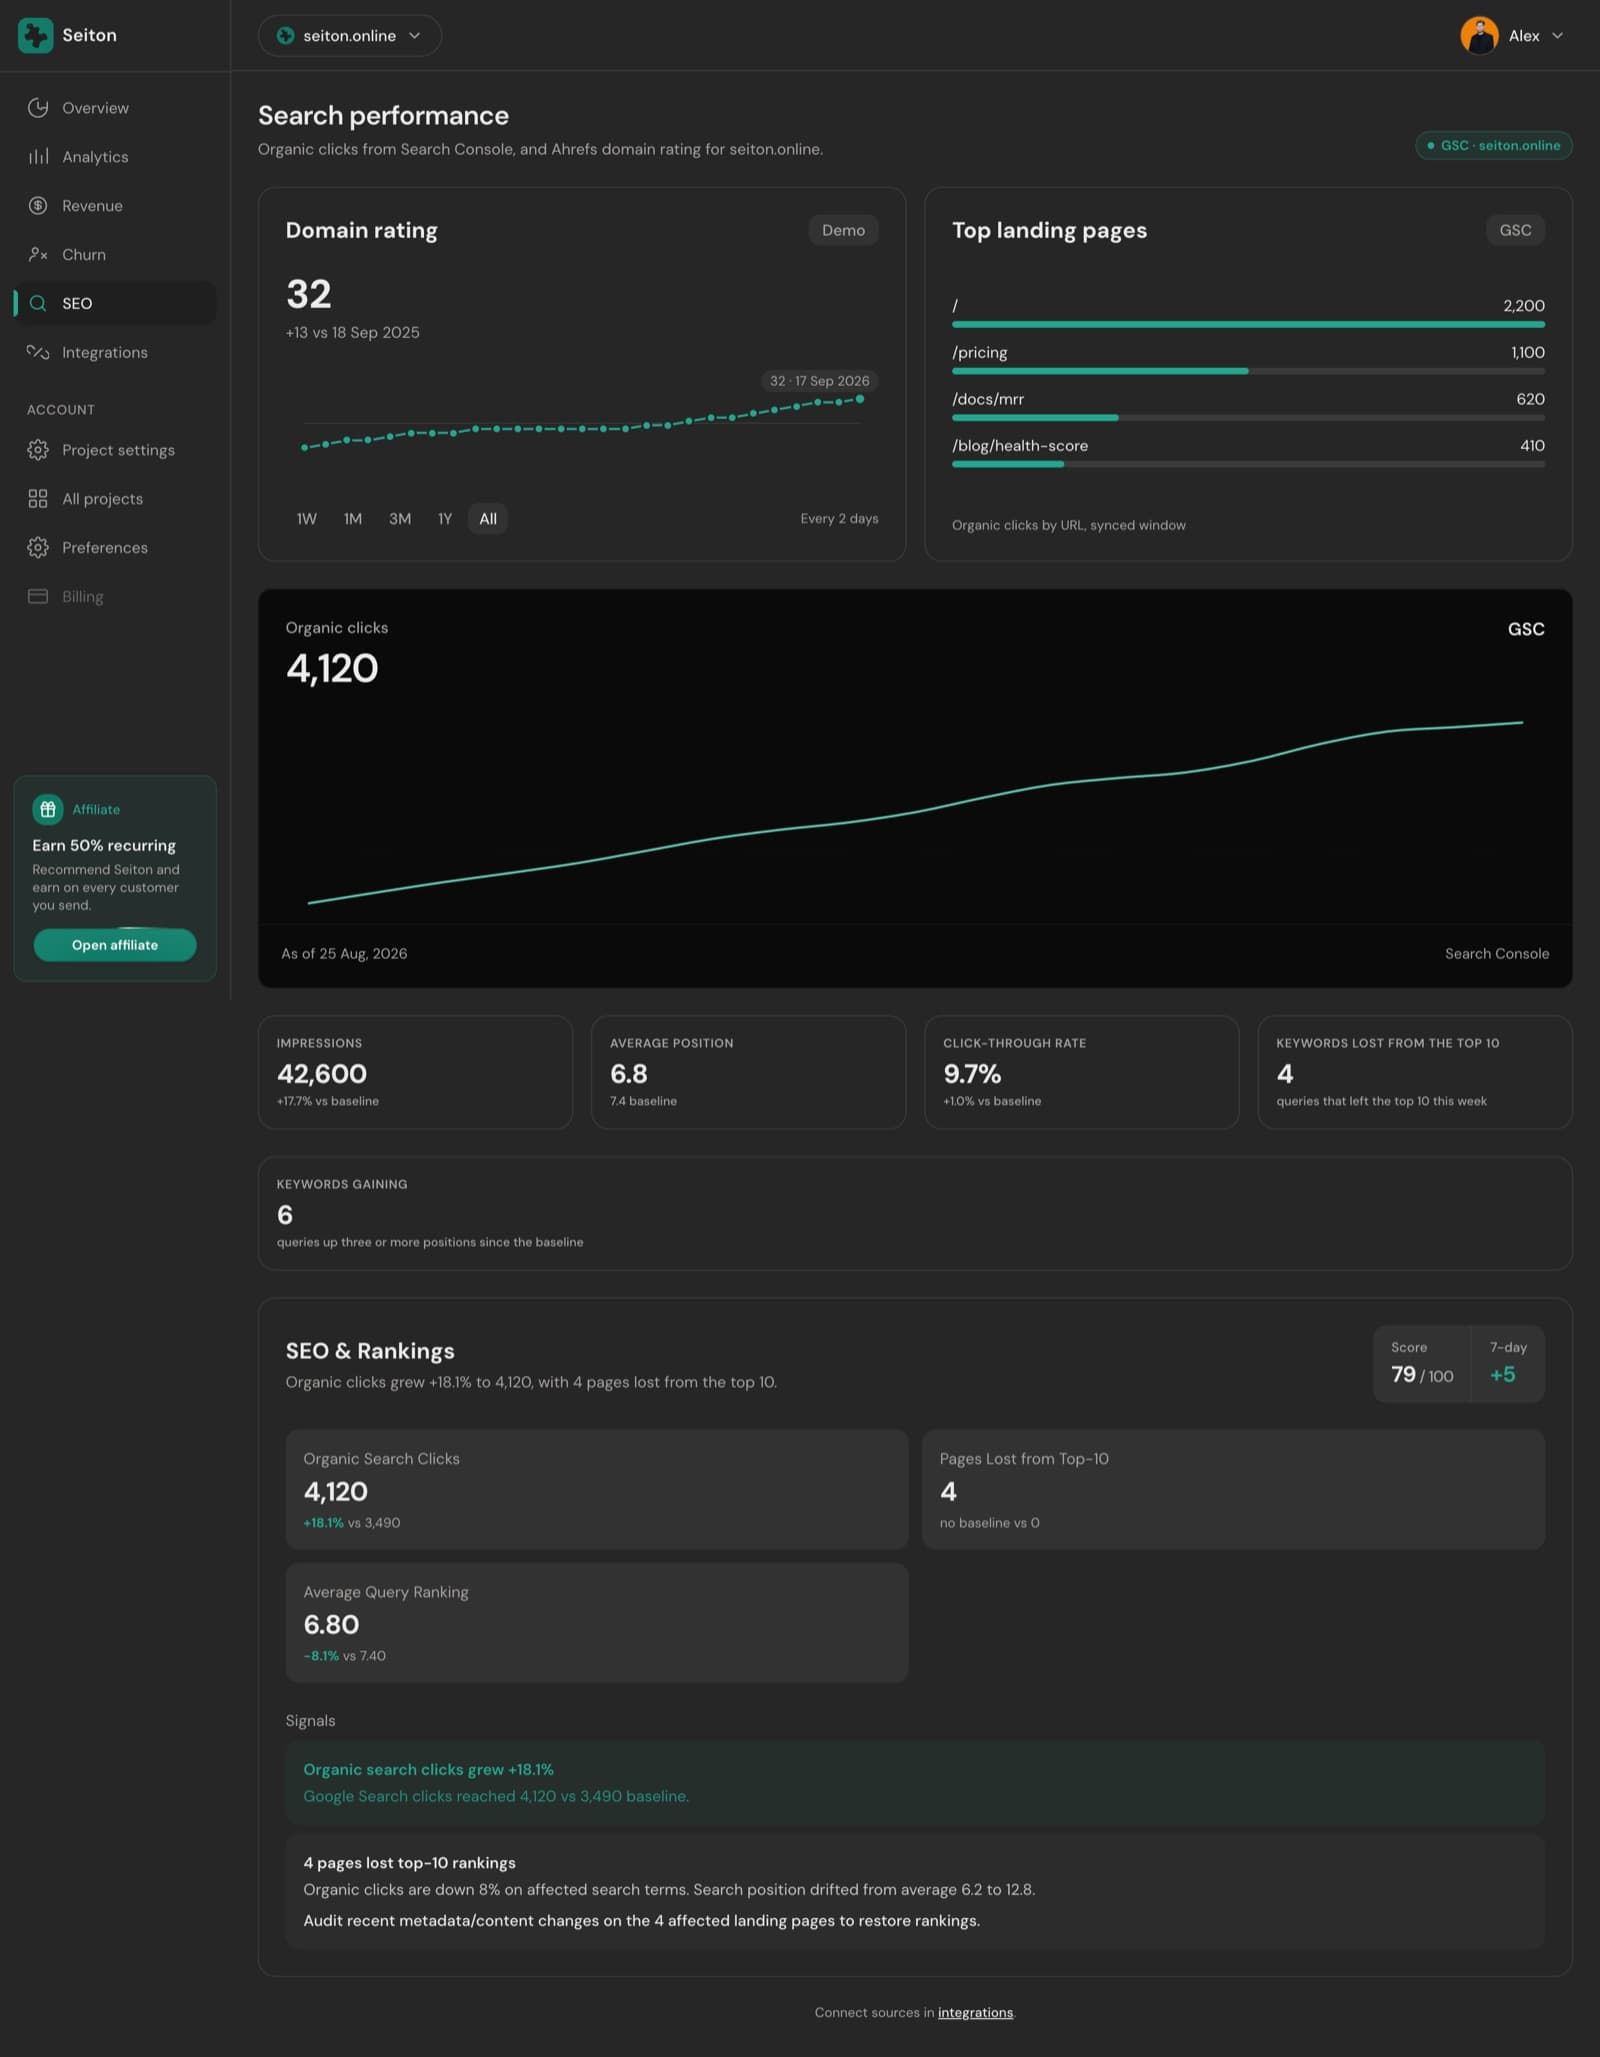
SEO — organic performance
Search Console clicks, impressions, average position and click-through rate, plus the queries that gained or lost the top ten. Domain rating is tracked separately on its own cadence.
Integrations — the sources behind everything above
Grouped by category slot, with the connection status, the freshness of the last sync, and the reason a provider is blocked when it is. Full detail on the Integrations page.
Settings — per project, and per account
Project settings sit under the project; account settings are one level up and apply everywhere.
| Panel | What it holds |
|---|---|
| General | Domain, timezone, the tracking snippet, and the danger zone. |
| Dashboard | What the project overview shows by default. |
| Revenue | The billing provider for this project and its key preview. |
| Team | Teammates on this project and pending invites. |
| Import | Bring historical analytics in from an existing tool. |
| Reports | Email briefing recipients, delivery time, and Send briefing now. |
| Alerts | Slack, Discord, webhook and email channels, and which severities each gets. |
| Widgets | Public badges you can embed on your own site. |
| API / MCP | Scoped sei_ tokens for this project. |
| Exclusions | Paths and IPs that should never count as traffic. |
| Security | Sessions and access for the project. |
The panel is chosen by the URL (?tab=reports), so every link into a specific tab is bookmarkable. Account-level settings live under Preferences: profile and theme, the founder profile, and account-wide API tokens. Billing — plan, invoices, cancellation — is its own page.
Something here wrong or missing? hello@seiton.online