
Core concepts
Health score
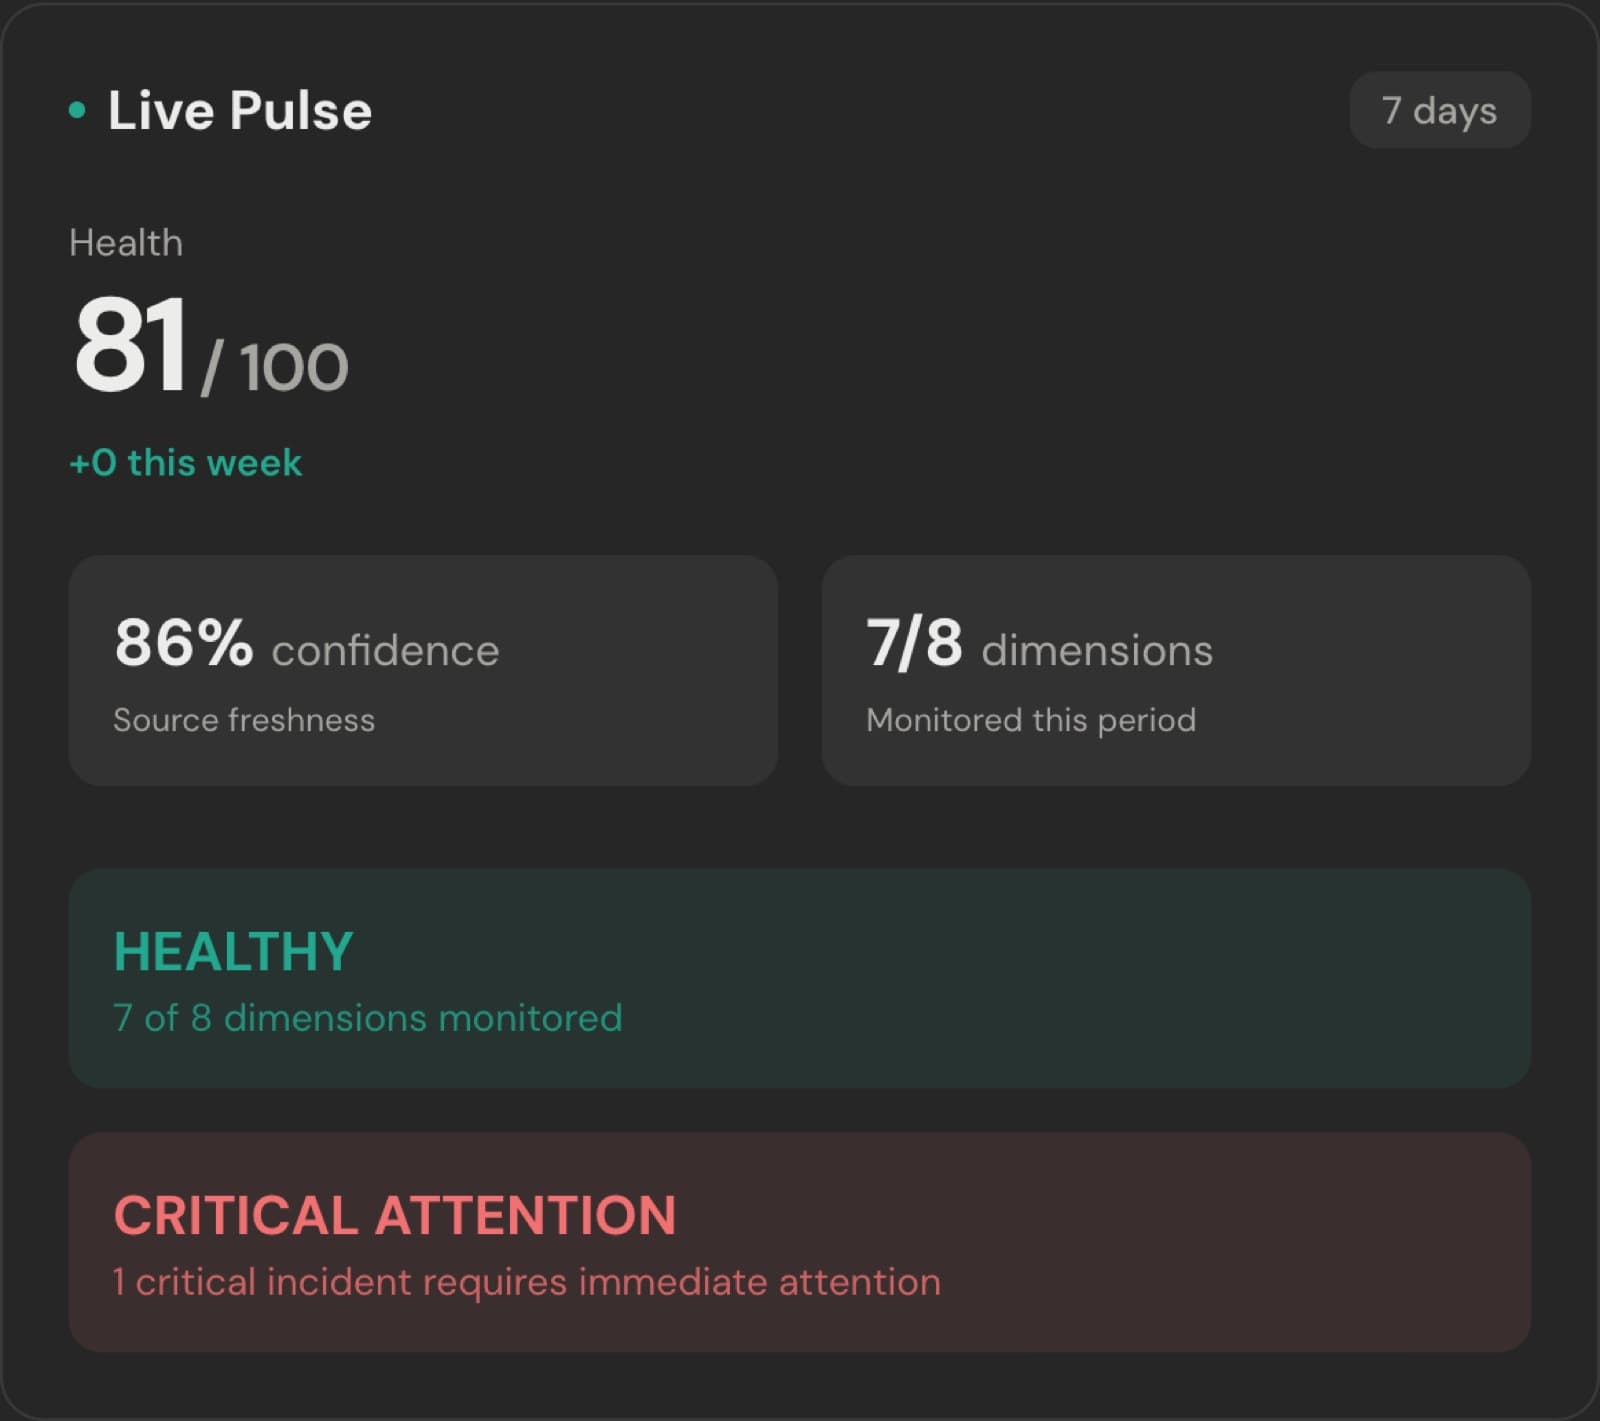
One number between 0 and 100, computed from the 8 dimensions that have data. It is deterministic: the same snapshot always produces the same score, and nothing about it is a model's opinion.
The dimensions
Each dimension is scored 0–100 on its own metrics, then folded into the composite by weight. A dimension with no trusted source is insufficient data — it is left out of the average entirely rather than counted as zero.
| Dimension | Weight | What it measures | Fed by |
|---|---|---|---|
| Revenue Health | 25% | MRR movement, new customers, failed payments, refunds. | Stripe, Paddle, Polar, Lemon Squeezy, Dodo Payments, Easytools |
| Retention & Churn | 20% | Monthly churn rate against its baseline, and the revenue that left. | Stripe, Paddle, Polar, Lemon Squeezy, Dodo Payments, Easytools |
| Growth & Traffic | 15% | Unique visitors and their trend. | Google Search Console, Seiton Analytics, PostHog, Google Analytics 4 |
| SEO & Rankings | 10% | Organic clicks, average position, pages lost from the top ten. | Google Search Console |
| Reliability | 10% | Error volume against baseline, crash-free sessions when reported. | Sentry, Vercel, GitHub |
| Product Health | 10% | Active days, stickiness, activation. | Seiton Analytics, PostHog |
| Infrastructure | 5% | Deploy success rate, database and edge incidents. | Vercel, Supabase, Cloudflare, GitHub |
| Estimated Profitability | 5% | Operating margin from MRR minus the costs you enter. | Stripe, Paddle, Polar, Lemon Squeezy, Dodo Payments, Easytools |
How the composite is calculated
- Take every dimension that has data, multiply each score by its weight, and divide by the weights actually used. Missing dimensions do not drag the number down — they shrink the denominator.
- Confidence is never multiplied into the score. A confident 40 and an uncertain 40 are both 40; confidence is reported next to it so you know how much to trust it.
- A dimension carrying a critical signal is capped at 49, and one carrying a warning at 79. A panel cannot show green while the signal underneath it is red.
- The 7-day trend compares today's composite with the one recorded roughly a week ago. With no history yet it is 0, not an invented delta.
Statuses
| Status | When |
|---|---|
| Healthy | 80 or above. |
| Warning | 50–79. |
| Critical | Below 50. |
| Insufficient data | No dimension has a trusted source yet. Shown instead of 0/100 — a project that has not synced is unknown, not failing. |
Confidence and coverage
Two different questions: how fresh the evidence is, and how much of the stack is watched at all.
- Confidence is the weighted freshness of the sources behind each dimension. A stale Stripe sync lowers it; reconnecting raises it back.
- Coverage is the "x of 8 dimensions" line. Below five monitored dimensions, or below 70% confidence, the overview says limited visibility outright and names what is missing.
- Data from a disconnected, revoked, errored or stale source is dropped from scoring rather than reused. See Metrics & ownership.
Why a dimension can stay empty
Every empty dimension names the source that would fill it: revenue needs a billing provider, SEO needs Search Console, Reliability needs Sentry, Product Health needs PostHog, Estimated Profitability needs your monthly costs. Until then it reports nothing instead of a plausible number.
Zero is a real reading
Zero errors today is zero, and it scores as healthy. The distinction that matters is between measured zero and nothing measured, and the product keeps those apart everywhere — dashboard, briefing and API.
Something here wrong or missing? hello@seiton.online